Queensland Housing Data: Key Statistics – October 2023
The latest Australian Bureau of Statistics (ABS) housing data for Queensland in October 2023 reveals a dynamic landscape with significant changes in the total number of dwellings approved, building types, and the overall value of building approvals. Let’s delve into the key statistics that define the current state of Queensland’s housing market.
Total Dwellings Approved
The seasonally adjusted estimate for total dwellings approved in October 2023 rose by an impressive 7.5%, reaching a total of 14,223 units. This marks a rebound from a 4.0% decrease in September, showcasing the resilience and adaptability of the housing market.
In terms of dwelling types, private sector houses experienced a 2.2% increase, totaling 8,505 approvals. On the other hand, private sector dwellings excluding houses saw a substantial surge of 19.5%, reaching 5,554 approvals.
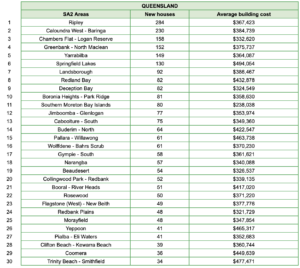
Queensland’s impressive expansion is unmistakable in the number of new houses, and the corresponding average building costs, reflecting a combination of robust demand and well-planned progress. It stands out as a flourishing center for emerging housing projects, with numerous SA2 regions spearheading this growth. The locales witnessing the most substantial influx of new residences include:

Source: OpenLot
Building Trends
Analysing the trend data provides additional insights. The trend estimate for total dwellings approved experienced a modest 0.3% increase, following a 0.2% uptick in September. Private sector houses, in trend terms, rose by 0.8%, while private sector dwellings excluding houses declined slightly by 0.1%.
Trends are essential for understanding the market’s direction, and the data indicates a steady positive trajectory, especially for private sector houses.
Regional Variances
Queensland’s performance is part of a broader national picture. Approvals for total dwellings across states were mixed, with Western Australia (11.0%), Queensland (10.7%), and New South Wales (9.6%) showing increases. In contrast, Tasmania (-14.4%), South Australia (-7.2%), and Victoria (-1.4%) experienced declines.
For private sector houses, Western Australia (11.7%), Victoria (6.5%), and South Australia (0.8%) saw rises, while New South Wales (-4.9%) and Queensland (-3.4%) faced declines in October.
Value of Building Approved
The overall value of building approvals in October 2023 also paints an interesting picture. The seasonally adjusted estimate reveals a 6.7% increase in the total value of building approvals, reaching $13.3 billion. The residential building sector contributed significantly, with a 7.0% rise, driven by an 8.9% increase in new residential building.
Non-residential building also experienced growth, with a 6.2% increase, indicating a diverse and robust construction sector.
Trends in Building Values
Examining the trends, the value of total building approvals fell 0.7%, but the residential sector remained relatively stable with a minor decline of 0.2%. Non-residential building values, however, experienced a more substantial drop of 1.2%.
These trends highlight the importance of considering both seasonally adjusted and trend data to gain a comprehensive understanding of the market’s performance.
Queensland’s housing market in October 2023 showcases resilience and growth, with positive trends in total dwellings approved, private sector houses, and the overall value of building approvals. While regional variations exist, the overall outlook is promising for the state’s construction and real estate sectors. As the market continues to evolve, keeping a close eye on these key statistics will be crucial for investors, developers, and policymakers alike.